Tree Medieval Poetess
30DayChart Challenge - Relationships | Clusters
with Plotly by nambona yanguere

"If you were truly in love with me, you would not blame my unveiled face."
Wallada bint al-Mustakfi (~1010-1091), Córdoba
This project dives into the powerful words of three amazing medieval women:
Anne Komnene,
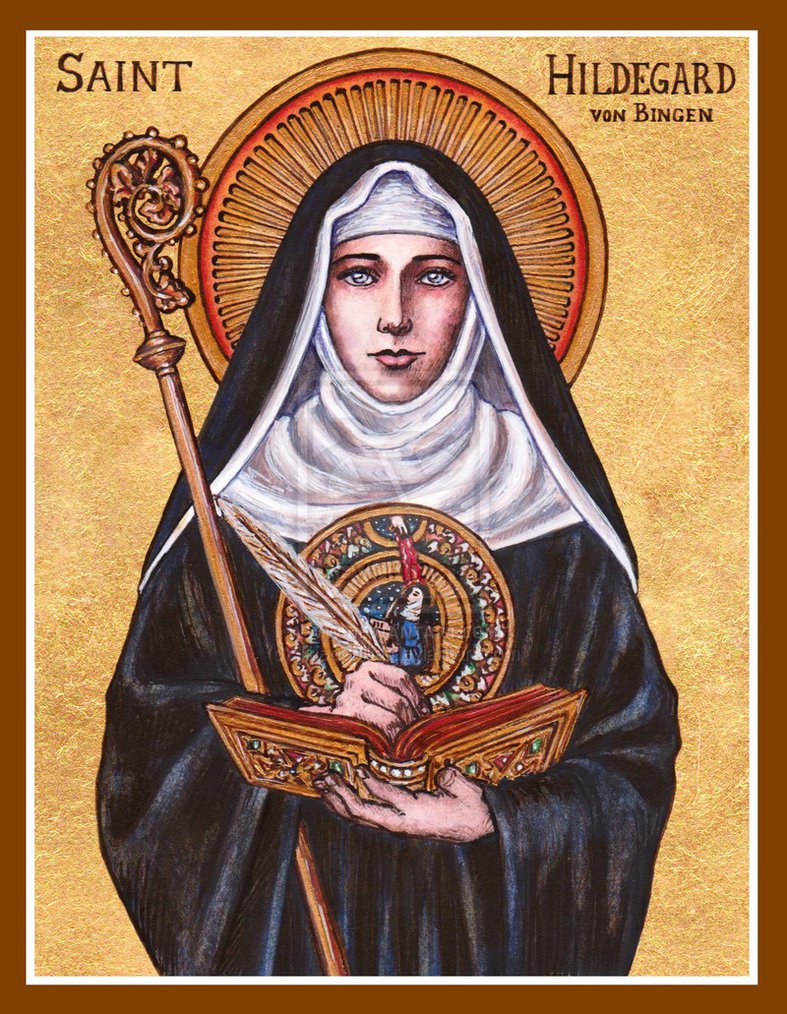
Hildegard von Bingen, and
Marie de France, who wrote poems, lais, and texts full of emotion, insight, and imagination.
Through clustering, connected scatterplots, and thematic mapping, the project seeks to:
Spot themes and emotions in their writing.| See how their styles compare and what makes each unique.| Show how their stories connect across time, space, and language.| Make their work feel alive and accessible through creative visuals.
More info about the competition
here
Link to my
Git
Alexiade [extrait]
Or si j’en suis venue à écrire l’histoire des actions de mon père,
voici surtout la raison.
J’ai été unie par un mariage légitime au césar Nicéphore,
un rejeton de la lignée des Bryennes,
homme qui,
par l’éclat de sa beauté,
O Clarissima Mater [extrait]
Comme est grand en sa force le côté de l’homme
d’où Dieu a fait sortir la forme de la femme,
dont il a fait le miroir de toute sa beauté
et l’entrelacement de toute sa création.
Dès lors les instruments célestes résonnent
et toute la terre s’émerveille,
Lai du Chevrefeuille [extrait]
Ils étaient tous deux
comme le chèvrefeuille
qui s'enroule autour du noisetier:
quand il s'y est enlacé
et qu'il entoure la tige,
ils peuvent ainsi continuer à vivre longtemps.
Step 2
Natural Language Processing (NLP)
Translation
The translation pipeline is used to translate French text into English, making it easier to apply emotion analysis models that work with English text. The translation model used here is `Helsinki-NLP/opus-mt-fr-en`, which is specifically trained for machine translation between French and English.
Emotion Classification
The emotion classification model detects the emotion conveyed in each translated line of text. It assigns each line an emotion label and a confidence score. This is a supervised machine learning model applied to textual data, trained to classify emotions like joy, sadness, anger, etc.
Frequencies of Emotions in the Poetic Texts
Step 3
Data Wrangling
Pandas DataFrame (sample)
This is a crucial data wrangling step to structure and organize the data for analysis and visualization.
Categorical Encoding
Categorical encoding is applied to convert the emotional labels into numerical codes. This transformation allows the emotional labels to be used effectively in visualizations, where color and size can represent these numerical values.
Step 4
Data Visualization
Plotting the Emotion Trajectory
For each poet, a line is added to represent the emotional trajectory of each poem, based on the scores for each line.
Emotion Trajectory of a poem - Lai du Chevrefeuille, Marie de France
Violin plot
Violin plots to display disttribution of emotion's intensity by Poet or by Emotion.
Distribution of emotional intensities by poetess
Distribution of emotional intensity by emotion
Connected scatterplot
Connected scatterplot is an hybrid between a scatter plot and a line plot, the scatter dots are connected with a ligne.
Connected scatterplot - A ligne by Poem
Step 5
Clustering
Clustering Based on Emotional Intensity
Cluster the verses based on emotional intensity into 3 groups with a simple clustering algorithm such as KMeans on the score column.
Emotional trajectory of the three poems with clusters by intensity
Display Verses by cluster
Emotional trajectory of the three poems with clusters by intensity
Nambona Adeline Yanguere
About Nambona Adeline Yanguere
Have a question? Email me!
All information on this page is for informational purposes only. Terms and conditions apply.